¶ My Space
My Space allows you to combine all the necessary dashboards for projects in one place and share them with colleagues in Cerebro universe.
When you first open the tab, the system offers:
- create a new page for displaying tracked tasks by using the '+Create' button located in the center of the screen form or the '+' button in the upper-left corner of the toolbar;
- open a previously created tab by clicking the Open button located in the center of the screen form or the Folders button in the upper-left corner of the toolbar.
When you create a new page in the Settings panel, which is displayed when you click the corresponding button in the upper-left corner of the window, you must specify the name of the page and tab, select the type of data representation, and determine the list of necessary criteria.
System allows you to display data samples in two views:
- selecting tasks based on the specified criteria;
- atrix representations of data.
¶ Selecting tasks by criteria
In order to form this type of data representation, click the ADD SELECTION CRITERIA button on the Settings panel. In the drop-down list, select the desired ones. The following criteria classes are available:
- General — main parameters of dashboards;
- By Task — list of available task attributes;
- By task tags — list of created tags;
- By messages — list of attributes for messages;
- By attachments — list of attributes for the attached files.
Selected criteria with a list of values defined by them are displayed in the Settings panel. The criterion can be used for a single dashboard several times, i.e. it is possible to set several samples of values and enable them if necessary in the Settings panel.
The following actions are available to manage the added criteria in the Settings panel:
- Collapse/expand criteria — allows you to group the displayed data by criteria;
- Define a criterion value — allows you to define a list of criteria values added to the data views;
- Set criteria for criteria — allows restrictions or rules for including values in the dashboard;
- Enable/Disable criteria — allows you to add/exclude a criterion when forming a data view, without removing it from the list of selected criteria;
- Delete selected criteria values — allows you to reduce the list of values defined for the criterion;
- Remove Criteria — remove a criterion from the list of selected criteria;
- Disable criteria — criteria is displayed in the settings panel but does not participate in the formation of the data representation.
¶ Matrix data representation
This type of data display allows you to control the process of work on projects in the context of activities. To work correctly, the project must have a tree structure with a depth of at least three levels, for example:
Sequence - > Shot - > Task
In this case, if you select a Sequence-level task in the Navigator window, the table rows will display the Shot — level tasks, and the columns will display the Tasks-level tasks.
The column headings are not the names of the tasks themselves at the Task level, but the set of activities by which these tasks are distributed.
In order to generate this type of report in the Settings panel, you need to activate the Show Subtasks option and define the list of activities in one of the following ways:
- automatically — select the activities of the final level tasks;
- manually by selecting the desired list from the drop-down list.
The table header contains buttons that allow you to set a visual representation of the displayed data:
- Collapse All/Expand All-collapse/expand information in columns by type of activity;
- Select displayed columns-define a list of table columns.
For each activity column in the matrix view, you can provide an individual set of displayed data by clicking the Select displayed columns button in the corresponding activity column.
Filter for the matrix representation can be set for any displayed column by clicking the corresponding button.
¶ Settings Panel
Also on the Settings panel, there are page management buttons located at the bottom of the panel:
- Duplicate current tab — allows you to duplicate the active tab on the current page. This tab is only available for the current user;
- Duplicate a page in user space — allows you to create a duplicate of the active page. This page is only available for the current user;
- Save page for the universe — allows you to share the page with all participants of the universe.
The list of pages saved for the entire universe is displayed when you click the Folders button on the toolbar.
¶ Toolbar
Toolbar is located above the workspace and contains the following elements:
- Pages/Tabs control panel — allows you to configure the list of displayed pages/tabs, set the structure of saving;
- Search bar — allows you to filter tasks by the query entered by the user;
- Filter Tasks button allows you to set criteria for forming the necessary selection of tasks;
- Export to Excel button — uploads the spreadsheet;
- Show statistics button — allows you to create charts that display Task Statistics related to certain types of activities within the project branch under consideration, as well as on the number of tasks marked with a particular tag.
In the Task Tracking window as well as in the Navigator tab, you can inline edit table cells (single left click). Double-left-click will highlight this cell (task) in the Navigator window.
¶ Page/Tab control panel
Page/Tab control panel includes:
- A row of displayed pages/tabs, allowing the user to quickly navigate between the created data views;
- Folder button. When you click on it, the list of created pages is displayed. The displayed data is divided into two tabs:
— Saved for the universe;
— My pages;
Users can set or change the save structure by clicking the Edit button at the bottom of the list. By default, the created pages are saved to the Unsorted shared folder. It is possible to create personal save folders; - Add Page button — allows you to create a new page;
- Settings button — allows you to set task selections by criteria ;
- Add Tab button — allows you to set a new tab for displaying data.
¶ Selection Сriteria
By selecting certain criteria you can set the parameters based on which data will be represented in the My Space section. The list of criteria is divided into the following classes:
- General — main dashboard parameters;
- By tasks — list of task attributes;
- By task tags — list of created tags;
- By messages — list of message attributes;
- By attachments — list of attached files attributes.
¶ General
- Projects — you can determine the list of projects that provide data for selection;
- Hashtags — you can determine the list of hashtags used for selection.
¶ By tasks
- Assigned users;
- Last level task — task that does not have any subtasks. Available options: yes, no;
- Last task message visible to clients;
- Last task report approved — tasks where last report has been approved;
- Subscribed users;
- Task activity;
- Task reported hours (users) — the number of hours submitted by the project's executors in Reports upon task completion. It is possible to select the exact parameter value or set limits (more/less);
- Task reported hours (resources) — the number of hours submitted by the project's executors in Resource Reports upon task completion. It is possible to select the exact parameter value or set limits (more/less);
- Task as event;
- Task budget;
- Task budget expenses — the amount of payments specified in the task Budget;
- Task checklist;
- Task cost overdraft;
- Task created by — task creator;
- Task creation time;
- Task deadline;
- Task declared hours (resourses);
- Task declared hours (users);
- Task has personal note;
- Task hours overdraft — the difference between the planned number of hours for the project/task and the reported number of hours upon completion. It is possible to select the exact parameter value or set limits (more/less);
- Task is archived;
- Task is deleted;
- Task is favorite;
- Task level — the level of task grouping according to the project structure;
- Task modification time;
- Task modified by — selection of users who have made changes to the task properties;
- Task name;
- Task path — you can determine the desired branch in the task structure to form the selection;
- Task personal note;
- Task planned hours;
- Task priority;
- Task progress;
- Task start;
- Task status;
- Task status type — you can determine the task stage for the selection, namely:
- Pending;
- In work;
- Completed/Closed.
- Task without assigned users — there are no users assigned to the task. Available options: yes, no;
- Task without status;
- Type of the latest task message.
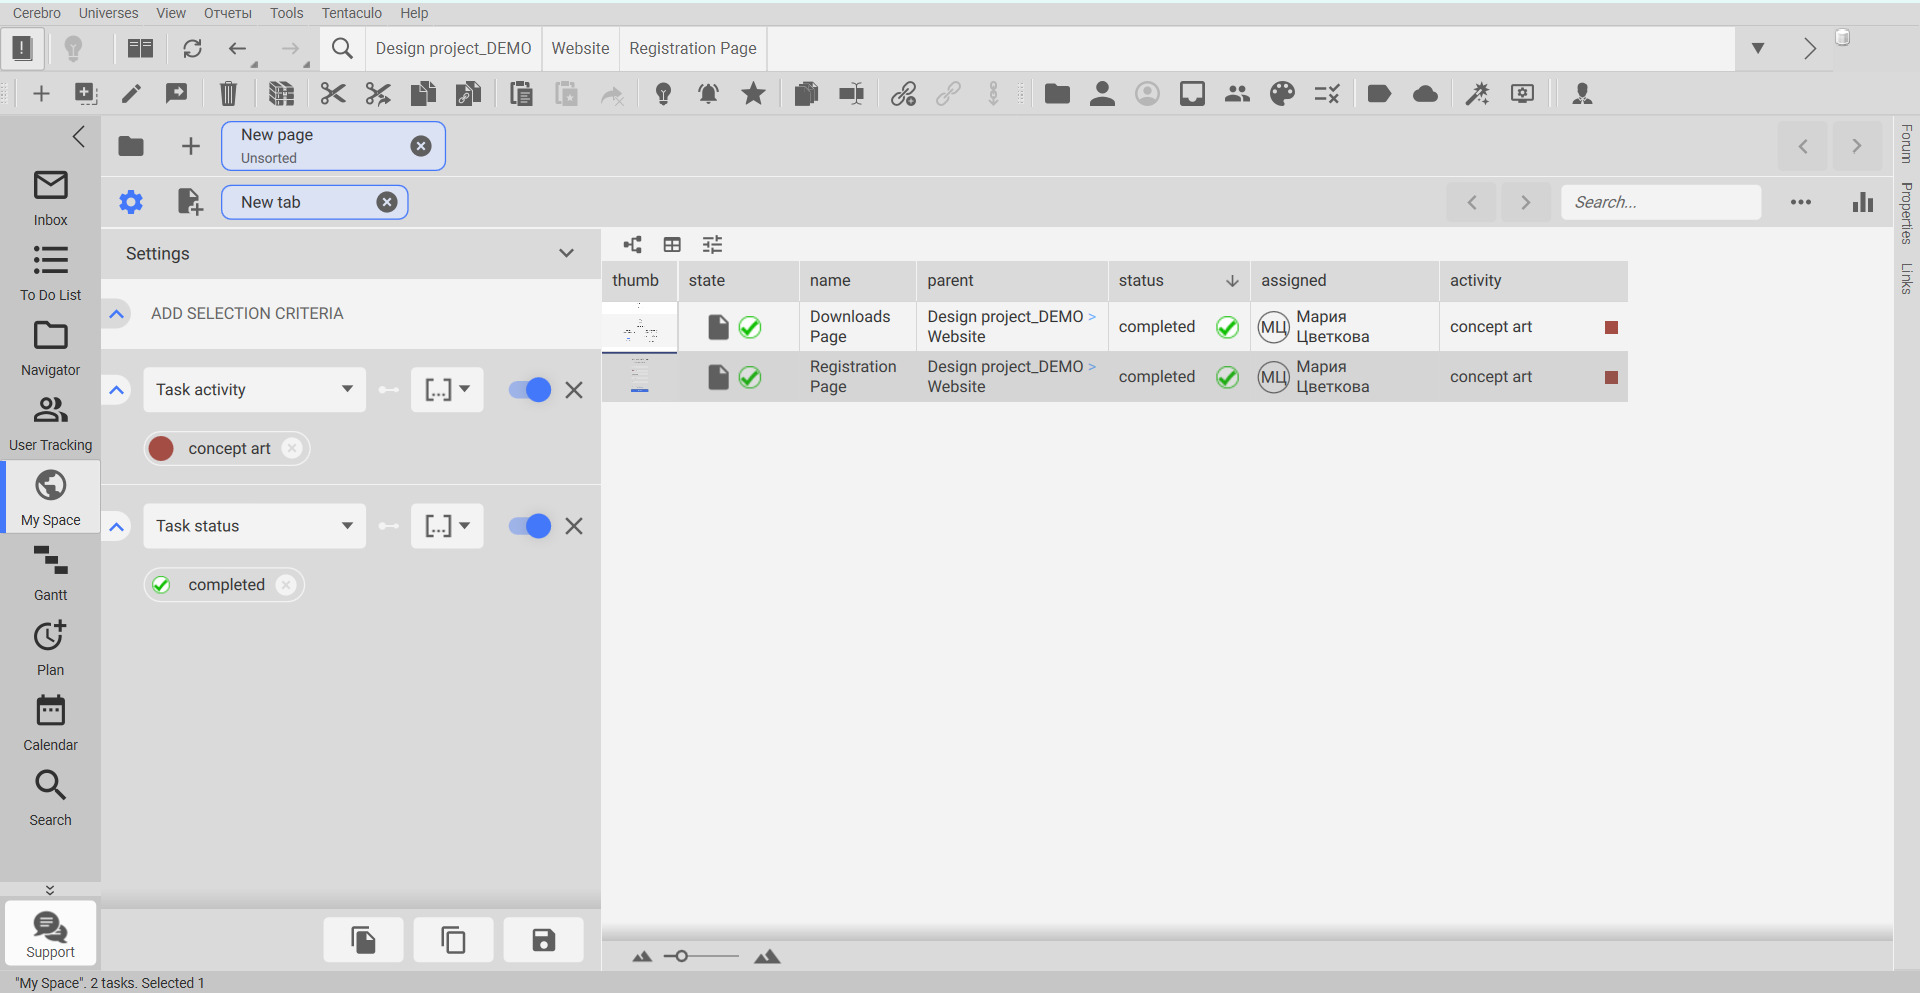
Example
You need to create a list of completed concept art tasks. For this purpose, you should:
- Add selection criteria:
- Task status;
- Task activity type.
- Set the values:
- completed;
- concept art.
As a result, you will get a table with a list of tasks according to the specified criteria.
¶ By task tags
- Tag without value;
- List of task tags created by users of the universe.
¶ By messages
- Last message with the attached file;
- Message author;
- Message creation time;
- Message is deleted;
- Message likes;
- Message modification time;
- Message text;
- Message type;
- Message visible to clients;
- Message with status;
- Report approved hours;
- Report declared hours;
- Report rating;
- User mentioned.
¶ By attachments
- Attachment creation time;
- Attachment file size;
- Attachment info;
- Attachment is approved;
- Attachment is deleted;
- Attachment name;
- Attachment type;
- Attachment with review.
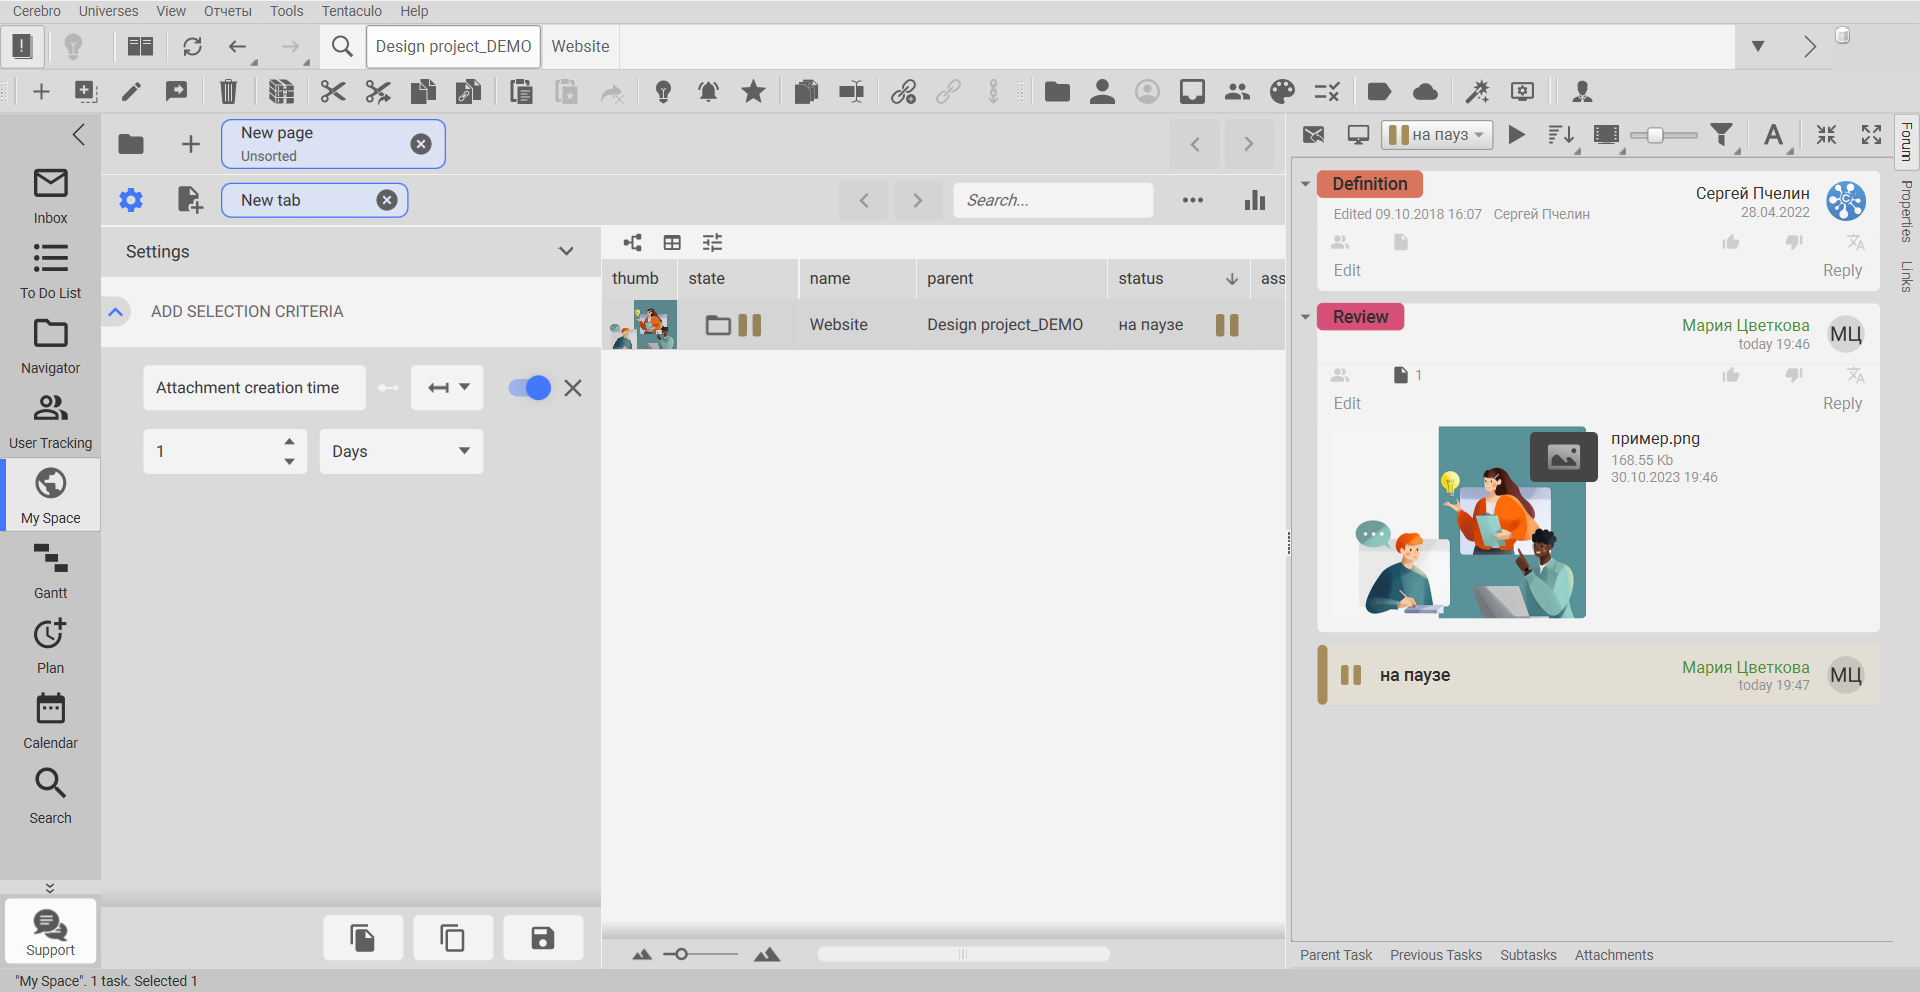
Example
You need to find all the attachments uploaded today. For this purpose, you should:
- Add selection criterion: Attachment creation time.
- Set the criterion value: for the last 1 day.
As a result, you will get a table that displays a list of tasks in which the last file has been uploaded today.