¶ Gantt Chart
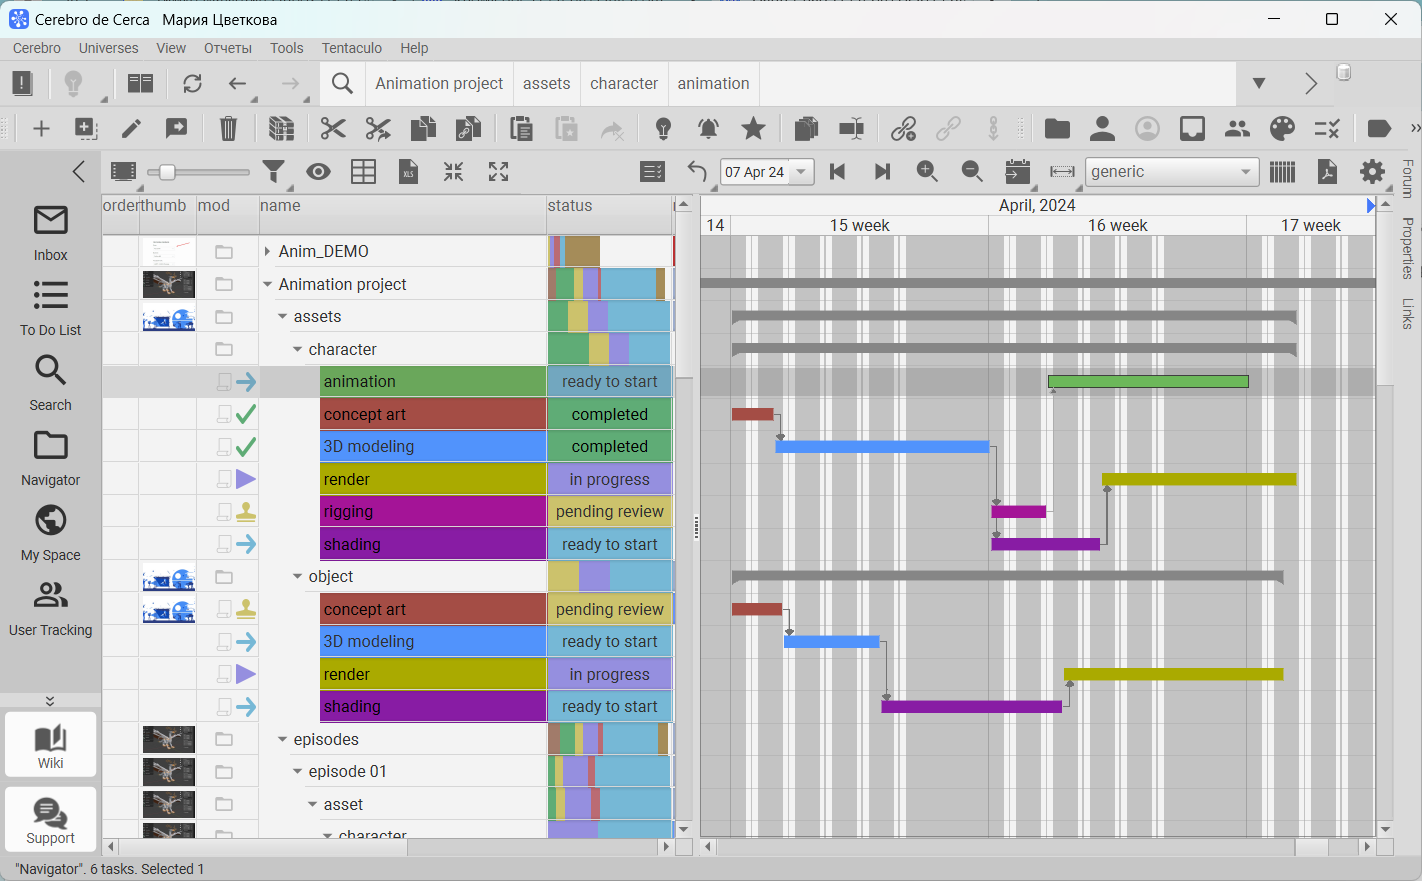
Gantt chart graphically illustrates the duration and the relative position of tasks on the timeline, as well as the connections between them. It is located in the Gantt tab in the main Cerebro window.
The chart consists of horizontal lines grouped according to the project hierarchy. If you expand the list of subtasks, the chart will display additional horizontal bars, each of which corresponds to one task in Cerebro and shows task duration on the timeline. It is possible to add color highlighting of the task timeline depending on the activity type or other task attributes by clicking the Tasks displaying button in the toolbar above the task tree.
The toolbar located above the chart contains the following controls:
-
Show fact time button for displaying the correspondence of planned and actual task execution time on the diagram. On the timeline line with planned task due dates, the time period between the first switch to status, meaning that the task is In Progress and the last one, meaning that the task is Is done/closed, is additionally highlighted.
The color of the line depends on the timeliness of completion:- red — the task is not started on the scheduled dates or the actual due date exceeds the scheduled period;
- blue — the actual deadline is within the planned period.
-
Undo button for canceling/reversing the user's actions with tasks to the original state;
-
Calendar which allows you to set up the date displayed on the timeline;
-
Previous/Next page buttons for navigating the timeline;
-
Zoom in/Zoom out buttons for scaling the chart and showing the required area;
-
The button for quick positioning on the desired chart interval. The available options are displayed in the context menu when you long press the button:
- Go To current task (default value) — displaying the current task duration interval on the timeline;
- To the current day;
- To the current week;
- To the current two week;
- To the current month;
- To the current year.
-
The button for automatic chart scaling. The available options are displayed in the context menu when you long press the button:
- View all (default value) — resizing the chart for all tasks to fit the window size;
- Scale To day;
- To week;
- To two week;
- To month;
- To year.
-
Working schedules button for selecting the work schedule displayed in the chart;
-
Button for launching a window in which you can create/edit the Work Schedule;
-
Button for exporting the contents of the chart (all or only a selected area) to a PDF file;
-
Button for Setting the chart contents display mode which includes the following options:
- Automatic scrolling across the chart to display the selected task's timeline in the chart. The available options are:
— Scroll to position the task at the center of the viewport;
— Scroll to ensure that the task is visible; - Disable smooth transition on tasks timeline;
- Adjust size of the task in the viewport — automatic chart rescaling for displaying the entire duration interval of the selected task;
- Show task name and allocated — displaying task attributes on a corresponding timeline;
- Switch the position of the panels — changing the location of the working areas.
- Automatic scrolling across the chart to display the selected task's timeline in the chart. The available options are:
¶ Navigating the chart
You can move across the chart by using the scroll bars or by dragging the window contents while holding down the middle mouse button.
To zoom in/zoom out on the horizontal scale of the image, use the mouse wheel while holding down the Shift key. Similarly, by holding down the Ctrl key, you can change the vertical scale of the task list.
¶ Changing task duration
If you want to set the start time for a task or change its duration, you can drag or stretch the corresponding bar in the chart with the mouse. Please note that in this case the adjusted time frames become fixed, i.e. they will not be automatically recalculated in the future.
In the context menu, when you right-click on a task, you can set the Fixed start and Fixed duration parameters which are equivalent to the lock buttons in the Task properties panel and which define if the corresponding value is fixed or "floating". In the chart, a fixed start or end is indicated by a filled square under a horizontal line that appears when you hover the mouse over the timeline.
¶ Connecting tasks
In the chart, the connection is shown as an arrow from the end point of one task to the beginning of another — which indicates that the second task has to start only after the first one is finished.
You can create a new connection between tasks in the chart in one of the following ways:
- by making a connection line from the first task (the one that finishes first) to the second one with your mouse. To do this, you need to "grab" the special circle at the end of the task bar with the left mouse button and pull a connection line to any point in the task timeline that you wish to establish a connection with.
- using the mouse and holding down the Ctrl key, select the timelines that need to be connected in the chart, and click the Link the selected tasks to the chain button in the Task Tools. The chain order is defined by the order in which the tasks were selected.
You can see all the connections of a selected task in the Links list in the Task properties panel. The outgoing connections are labeled with the keyword to, and the incoming links are labeled with the keyword from. Connections are also displayed in the Connections tab on the right sidebar.
You can delete connections from the list by choosing the Break link option in the context menu. A similar option is available in the chart's context menu which can be accessed by right-clicking on the required task.